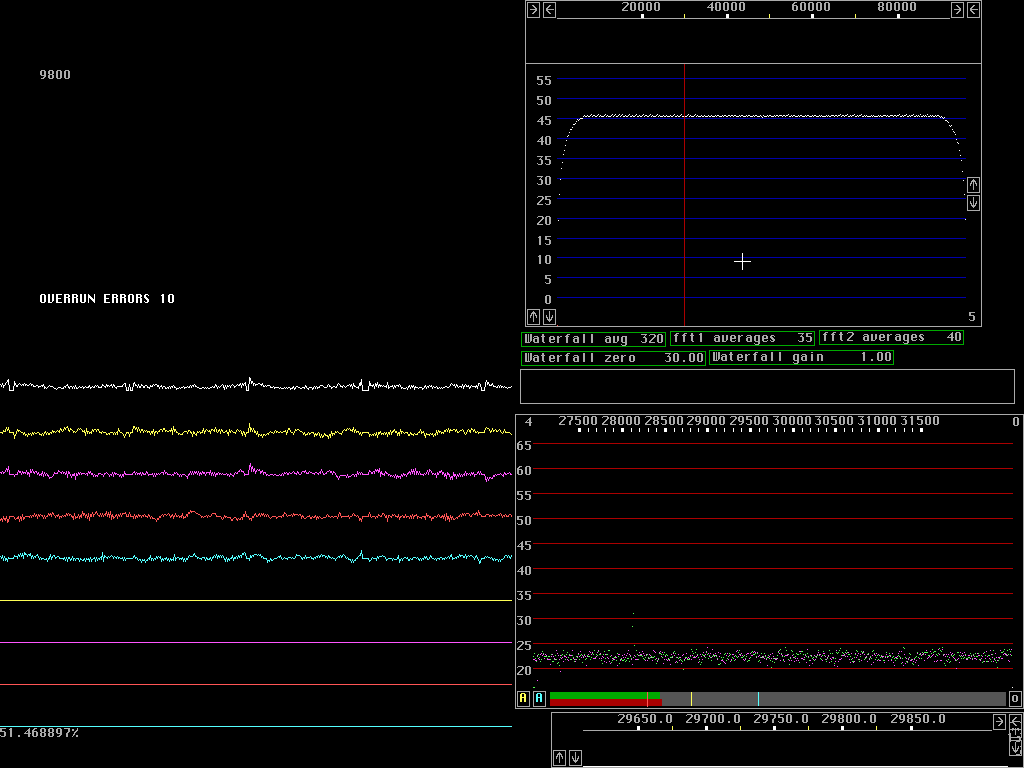
Fig 1. Quiet screen. Only a very weak signal is added in channel 1 (green). Hardly visible in the wide graph but about 8dB above the noise floor the high resolution graph.
|
This page shows 5 screen dumps that illustrate the noise
blanker operation in a system with about 90% bandwidth.
Check here
Relative bandwidths for some comments on relative bandwidths.
Figure 1 shows the screen when no noise pulses are applied. The wide graph (upper right corner) shows how the noise floor of the system is degraded towards the spectrum ends. Under normal conditions there will be a preamplifier that adds 20dB noise and masks the A/D converter noise. At the edges of the useful bandwidth the preamplifier will add only 15 dB causing something like 0.1dB loss of noise figure. The high resolution graph, lower right shows a weak signal which can also be seen in the wide graph left of the signal cursor, the red vertical line. |
|
Figure 2 shows the screen when a noise source is switched on.
The noise source produces pulses with a repetition frequency
of about 800Hz.
The oscilloscope function (Check mouse_on_graph.txt for info)
on the left side of the screen shows the input signal in complex
format for the two channels and the summed total power in white
on top.
The oscilloscope shows the second time function which is the input to the high resolution graph. The lower four tracks are zero, there are no strong signals present. The noise floor is raised by 42dB and the weak signal is completely invisible. Adding a lot of noise like this makes the wide graph show the frequency response of the system. The total filter chain is nearly perfect because there is a digital filter that compensates for the influence of the analog hardware. The noise blanker requires the system to be properly calibrated because the desired passband function set up in the calibration procedure is used to calculate the pulse response of the system. The calibration procedure ensures that the real pulse response is very accurately the same as the desired one.
|

|
Figure 3 shows the operation of the "dumb" noise blanker.
It will just clear all points for which the total power is
above a threshold.
The weak signal is now visible despite the severe impulse noise but it is a little weaker than before. Clearing 18% of the points (upper right corner of wide graph) removes 18% of the signal energy. The noise floor is about 2dB higher than before so the total loss of S/N is in the order of 3dB. The "dumb" blanker is not as dumb as a conventional noise blanker because it does not affect strong signals. Any strong signal that might be present in the passband is attenuated using AGC and routed directly to the second fft without noise blanking. When strong signals are present they show up in the lower four tracks of the time function. Cutting holes 18% of the time in a strong carrier would produce noise sidebands (keying clicks) containing about 18% of the energy of the strong pulse. Strong signals would also be mixed with each other. It still remains to find out how this noise blanker compares to the best conventional noise blankers under real operating conditions.
|

|
Figure 4 shows the operation of the "smart" noise blanker.
A standard pulse with amplitude, phase, fractional position
and polarisation is fitted to the peak of each pulse.
The standard pulses are then subtracted from the signal
wave form.
There is some error in this process so the pulses do not
disappear completely, but they go down by about 30dB.
|

|
Figure 5 shows both blankers operating together.
The "smart" blanker is first used to reduce the pulse amplitudes
and thereby making the pulses narrower.
The "dumb" blanker now clears only 4% of the data points
despite the fact that the threshold is lower as a consequence of
the lowered noise floor.
|

|
Blanker control is the lowest part of the high resolution graph.
The yellow A (automatic) selects the threshold for the
"dumb" blanker to be a fixed distance from the noise floor.
The noise floor is the horisontal bars (dB), green and red for
channels 1 and 2 respectively.
The yellow line is the current threshold position (mouse movable)
The red line is recommended minimum noise floor 20dB above
a single bit.
The "smart" blanker, blue, is controlled the same way.
In figure 5 the "smart" blanker operates at 0%, as indicated in the upper right corner of the high resolution graph. This means that less than one noise pulse is subtracted for every 100 data points. This is as expected with a pulse repetition frequency of 800Hz in a digital bandwidth of 96kHz. (0.8%) The graphs on this page were produced with a PentiumIII at 650MHz and a Delta44 A/D converter sampling at 96kHz. The first fft used sin squared windows and a fft size of 8192 to provide a bandwidth of about 23Hz. At this early stage the second fft is still inefficient using floating point arithmetics. It used the same size and window as the first fft which does not matter for the blanker evaluation. The second fft (if enabled) will provide input for the waterfall display and search of weak signals. For optimum sensitivity bandwidths down to about 0.35Hz or 524288 point fft would be desireable. Whether such performance can be obtained with current hardware is unclear but 65536 fft will be no problem using MMX instructions. With ultimately 512 points behind each pixel on the screen there will be a need for a fast search algorithm that will locate the strongest signal behind each pixel and display the corresponding signal level. The high resolution graph always displays one pixel per data point so the full screen width of the high resolution graph will show only two pixels of the wide graph at maximum resolution.
|