|
When the Linrad S-meter graph is run at its highest speed
each sample is plotted on the screen and only one curve,
the RMS power is plotted for each RF channel.
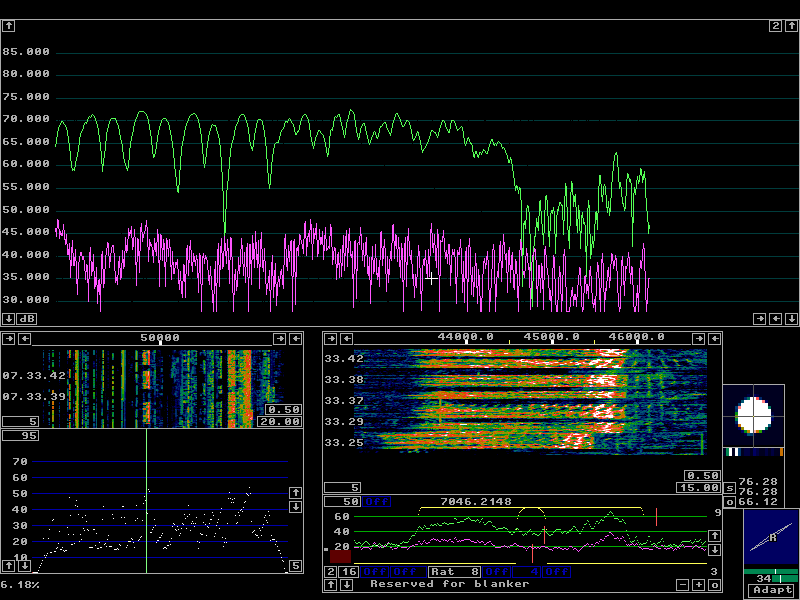
Figure 1 shows the SSB signal of OZ7FD received on 7 MHz
with two antennas. One vertical and one horisontal.
The graph speed is set to maximum.
|
|
|
|
Fig 1. An SSB signal on 7 MHz received with two
orthogonal antennas.
In the S-meter graph, green is RMS power with the optimum polarisation,
magenta is the orthogonal signal.
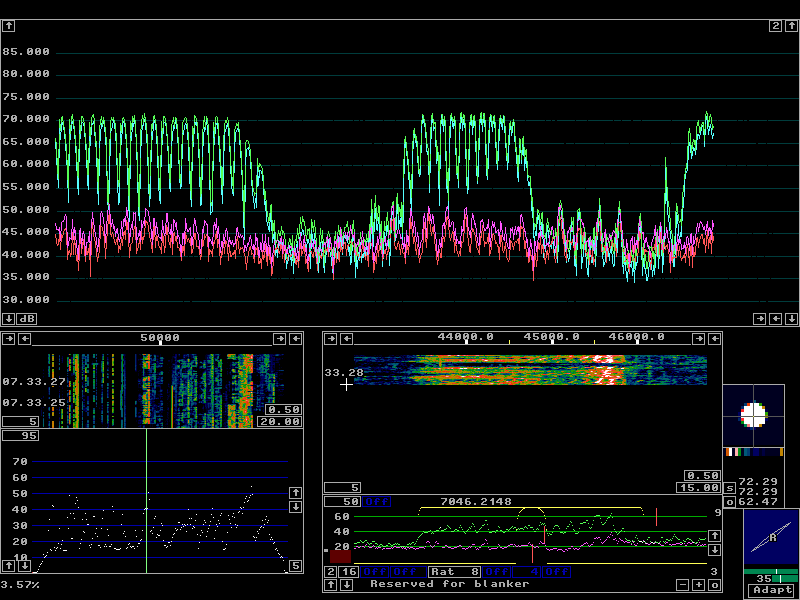
Figure 2 shows the same signal as figure 1 at a slower speed. Each data point in the graph represents several samples of the digital waveform and therefore there is an ambiguity. The Linrad S-meter graph shows two curves for each RF channel if "2" is selected in the appropriate box. One curve is the RMS average of all the points, the other is simply the largest value within the group of samples behind each pixel on screen. |
|
|
Fig 2. An SSB signal on 7 MHz received with two
orthogonal antennas.
In the S-meter graph, blue is peak power with the optimum polarisation,
green is RMS power with the optimum polarisation,
magenta is the peak power of the orthogonal signal and
red is the RMS power of the orthogonal signal
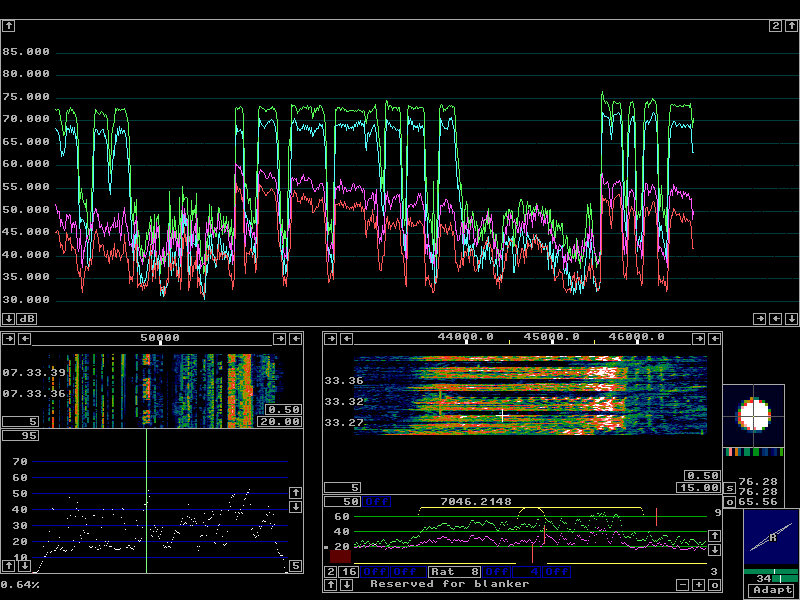
Figures 3 and 4 show the signals of OZ7FD and SP3QFV at a slow speed, suitable to evaluate the peak to average power. |
|
|
Fig 3.OZ7FD. Peak to RMS power is 3 to 5 dB on vowels.
|

|
|
Fig 4. SP3QFW. Peak to RMS power is 3 to 5 dB on vowels.
On the loudspeaker the signal from SP3QFW sounds far more compressed than the signal from OZ7FD. Yet the peak to average power ratio is no better (lower). Maybe the reason is due to the selective fading, but more probably the explanation is in the difference between RF clippers and AF clippers. Figure 5 shows the signal of ON5KQ. It is recorded with one RF channel only so there are only two curves. Subjectively the signal sounds like the signal of SP3QFW. One can hear that a speech processor is in use. Both signals are very easy to copy but it is obvious that ON5KQ has a smaller peak to average power ratio and consequently about 2 dB higher average power. Seems he is using an RF clipper.... |

|
|
Fig 5. ON5KQ. Peak to RMS power is about 2 dB on vowels.
To SM 5 BSZ Main Page |