The noiseless feedback amplifierBy use of transformers one can apply both voltage feedback and current feedback. There was an article in Ham Radio november 1979 by DJ2LR Ulrich Rohde giving details about this circuit.For the 2.5MHz to audio converter the transformation ratio from drain to source is 2:1. The output transformer, TR3 in fig. 1, is 9 turns trifilar wound on a 16 mm toroid. Two of the windings are connected in series at the drain side. The drain is loaded by one 100 ohm resistor to ground and one 100 ohm resistor to the bandpass filter. For details, see the circuit diagram of fig. 1. The input impedance of the filter is about 100 ohms within the passband but it varies a little. Outside the passband the input impedance of the filter is lower. The impedance at the drain of the transistor is very low due to the feedback. The impedance feeding the filter is therefore 100 ohms regardless of what impedance is connected to the input of the amplifier. The third order input intercept point, IP3 of the amplifier is about 40 dBm. The 1dB compression point is at +15 dBm when clipping occurs at the drain. The RF voltage at the drain is then 20V which makes the power absorbed in the 100 ohm resistor 0.4W. Two input signals of +8 dBm give third order IM at -55dBc while two signals at 0 dBm gives IM3 at -81dBc The input transformer, TR5 in fig. 1. steps up the voltage by a factor of 2.5 from the antenna input to the gate. The source current is routed through a small winding to provide a load on the transformer that makes the input impedance 50 ohms. The input transformer is loaded by the input capacitance of the transistor, the inductance of the transformer balances for a low Q resonance at 2.5 MHz. By reducing the number of turns on the transformer and adding a capacitor at the input, C116 in fig. 1, it would be possible to make the Q of the input resonance higher to attenuate signals well away from 2.5 MHz. The final design does not use any capacitor at C116 because 2.5 MHz is an IF frequency and the stages in front of it can not emit any signal well away from 2.5 MHz at a level that would be a problem for the 2.5 MHz amplifier. High Q in the input transformer is meaningless in this case. The input transformer, TR5, is wound on a ferrite toroid core from Ferroxcube (Philips). Material 4C65, type TN 14/9/5. The gate winding is 31 turns, the source winding is 3 turns and the input winding is 12 turns. Wire dimension is uncritical. The drain transformer, TR3, is wound on a ferrite toroid core from Ferroxcube (Philips). Trifilar 3 x 9 turns. Material 4A11, type TN 16/9.6/6.3.
|
These inductors are critical. If a single toroid Amidon T80-2 with about 40 turns is used for these inductors, IP3 is degraded by 10dB within the passband. Air core coils become very big for a similar Q but allow an higher IP3.
It seems reasonable to use the Amidon cores. Well outside the passband a much smaller voltage is present across the inductors so IP3 will gradually go from 30dBm within the passband to 40dBm for signals well outside the passband. Within the passband dynamic range is limited by the Delta44 saturation at -16dBm so IP3 = 30dBm means that third order intermodulation is at -90dBc with near saturating signals within the passband.
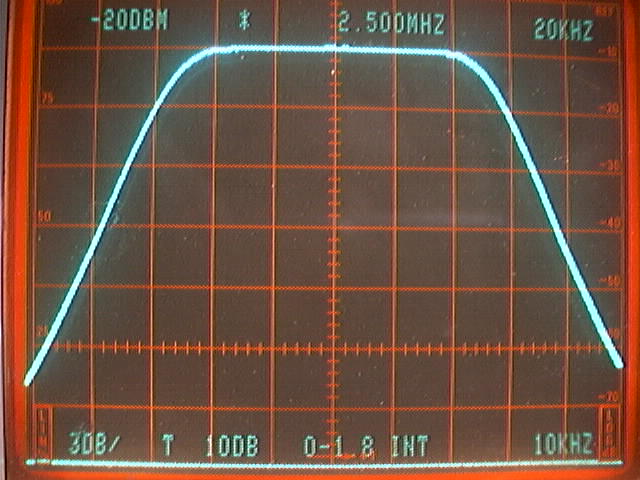
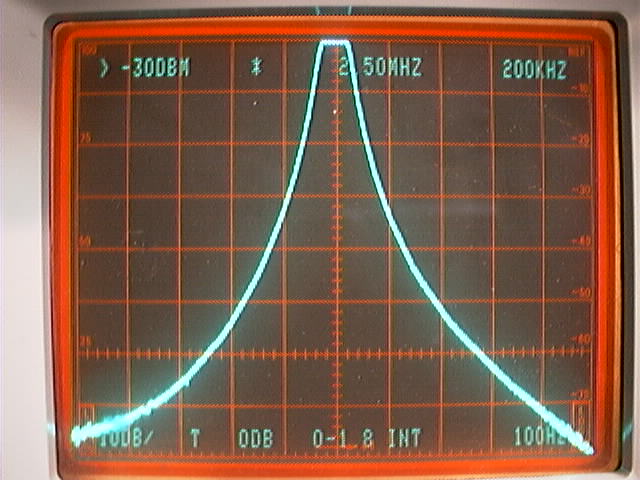
The frequency response of the 2.5MHz filter is shown in figures 2 and 3.


To give some idea about the source of nonlinearities figures 7 and 8 show the same two signals as fig 6 but with 11dB attenuation. For fig. 7 the attenuation is placed between the 2.5MHz to audio converter and for fig. 8 the attenuation is placed in front of the 2.5 to audio converter.


When the system is used for weak signal communication the noise floor will be 15 to 20 dB higher than it is in figures 4 to 8 because the noise from the preamplifier should be dominating completely for a good system noise figure. The spurs shown in the screen dumps above will not be a problem but saturation will occur somewhere around 130dBc/Hz for signals within the passband. Outside the visible passband the dynamic range is much larger, it will probably depend on the mixers and amplifiers used to convert from other frequencies to 2.5MHz.