
Calibration accuracyThe calibration procedure of Linrad measures the frequency response of the hardware in use by means of the pulse response. To calibrate one has to use a pulse generator.The different RX2500 units are very similar in frequency response so it is possible to use the calibration from one unit to get some functionality with another unit. Even small differences in the frequency response affect calibration. Fig.1 shows what happens when the calibration from one RX2500 unit is used for another unit. Fig. 1 shows Linrad running for a while on the RX2500 unit for which it is calibrated. Linrad was then paused while the RX2500 unit was replaced with another unit. Linrad was then restarted. It is quite clear from fig.1 that the blanker does not perform as well on the unit for which it was not calibrated.
|

The RX2500 unit has an RF amplifier at the input to isolate the 2.5 MHz bandpass filter from the signal source and make the frequency response less sensitive to changes of the source impedance. Since the calibration is sensitive to fractions of a dB one has to be careful to feed the RX2500 unit with calibration pulses from a pulse generator with the same output impedance as the converter to be used to convert the desired frequency band to 2.5 MHz. If a RX10700 unit is to be used the best solution is to feed the pulse generator to the 10.7 MHz inputs. This way calibration will be accurate for the well defined output impedance of the RX10700 unit.
Pulse response of calibrated and uncalibrated RX2500A typical frequency response for the uncalibrated RX2500 is shown in fig. 2. This is the spectrum obtained with a 50 ohm pulse generator connected to the input. The frequency response of the RX2500 unit roughly matches the noise floor of a Delta44 A/D converter.
|

The calibration procedure adds a digital filter inside Linrad which leads to a very flat frequency response. Fig. 3. is the frequency response with the calibration function used on this page. This calibration function, the dsp_wcw_corr file as well as the parameter files used for the screen dumps on this page are contained in this file: par.tbz (6496 bytes) a tar archive packed with bzip2.
|

The calibration procedure does not only adjust the spectrum amplitudes to allow higher gain in the waterfall graph with an improved sensitivity for weak signals as a consequence. It also adjusts the phase to make the pulse response better. |

|

|
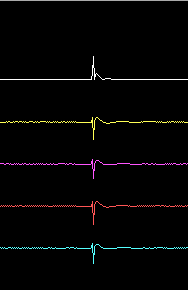
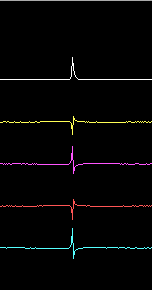
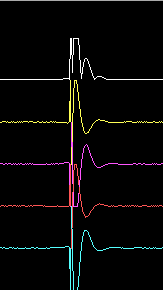
Fig. 4 shows the pulse response of the entire system by use of the timf2 oscilloscope function with a gain of 0.0019, both calibrated and uncalibrated responses are shown. At the very low gain of fig. 4 it is not so easy to see the difference because the RX2500 unit has a rather good pulse response already. Fig. 5 shows the same as fig. 4 but the gain is increased by 16 times (24dB). Here one can see that the pulse duration is reduced by approximately 50%. The calibration procedure reduces the pulse duration by much larger factors for systems with hardware having poor phase response but even 50% is useful.
|

|

|
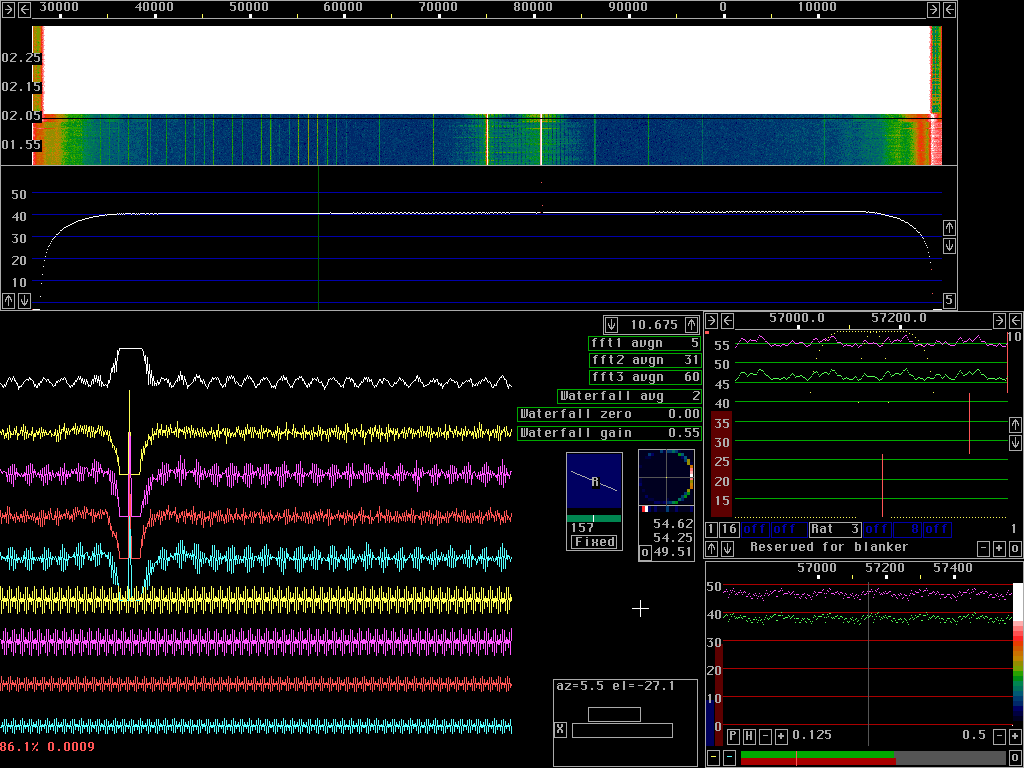
Linrad noise blanker operation with RX2500 in a simulated difficult situationTo simulate a real situation, a strong signal and many weak signals were injected into a RX10700 unit which in turn was connected to a RX2500 unit. The strong signal was from a crystal oscillator and the weak signals were produced by a HP8657A signal generator set for 1kHz FM modulation with a frequency swing of 18kHz. The resulting Linrad screen is shown in fig. 6. Note that S/N is 17dB for the desired signal at 10.657150 with the bin bandwidth of the baseband spectrum (green dB scale)
|

The main spectrum of fig.4 shows the white noise floor which is close to 0 dB corresponding to the blue colour in the waterfall graph. In fig. 7 a pulse generator is switched on, adding pulses to the input signal. The Linrad noise blankers are enabled and the waterfall graph shows that the Linrad noise floor is not much affected by the pulses. The lower part of the waterfall is from before the pulser was switched on. The interference at the moment the pulser was switched on is because Linrad was stopped to produce the screen dump for fig. 6. |

A comparison of the baseband signal in figures 6 and 7 shows no significant change in either signal or noise levels. The S/N ratio is unchanged. The blanker has sucessfully eliminated the interference pulses. When the blankers are switched off, the noise floor rises by 30 to40 dB It is impossible to hear anything except the strong signal at 10.681 MHz
|
