|
The polarization graph in Linrad is present when Linrad is
used with hardware that send two RF channels into the computer.
The two channels have to be derived from common local oscillators
so the phase relation between the two RF channels is preserved.
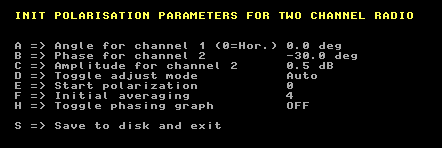
Linrad will combine the two RF channels by use of an orthonormal transformation. This results in two new RF channels with all the signal in one of them and nothing in the other. The linear combination of the signals from two antennas is a way of changing the radiation pattern or the polarization properties associated with the two output signals. Often one of them is rejected because the desired signal is not present there. Linrad can set the two parameters that govern the orthonormal transformation automatically. That results in adaptive lobe forming or adaptive polarization When a new Linrad installation with two RF channels is set up for the first time the menu in figure 1 will appear. Press X then D to reach this menu from the normal processing screen. |

|
|
Fig 1. The permanent polarization parameters.
Here a difference in cable lengths is compensated by a 30 degree phase shift
between the channels and an unbalance of gain is compensated by 0.5 dB.
The polarization graph shows the transformation parameters graphically in a way that should be immediately clear to anyone using a cross yagi. Someone using other types of antennas can read the two transformation parameters from the graph and translate it to patterns by use of knowledge of the radiation pattern of the antennas in use. With other antennas, enable the The phasing window With the permanent parameters of figure 1 the polarization graph will look like in figure 2 when reception is started and before any signal is selected (clicked on.) |

|
|
Fig 2. The polarization graph at startup with
the parameters of figure 1.
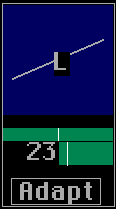
The two RF signals IN1 and IN2 are combined to give two output signals like this: OUT1 = A * IN1 + B * IN2 OUT2 = A * IN2 - B * IN1 A and B are complex coefficients. Only the ratio A / B and the phase difference between A and B matter. In figure 2 A=1 and B=0. That means that the signal from RF channel 1 is routed to audio channel 1 while RF channel 2 is routed to audio channel 2. The horizontal line with the associated angle 0 in numbers shows that the polarization plane is not twisted by the processes in Linrad. This is how the graph would look if a horizontally polarized signal were received. If a signal is present in both channels with the same phase or opposite phases the polarization is linear but not aligned with one or the other antenna. A and B are then real numbers that take the values A=cos(v) and B=sin(v) where v is the angle between the polarization plane and the horizontal plane. In figure 3 the angle v is 23 degrees. |
|
|
Fig 3. The polarization graph when receiving
linear polarization at an angle of 23 degrees vs the
horizontal plane.
Permanent parameters as in figure 1.
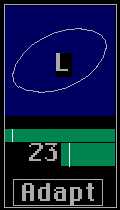
Figure 4 shows how the polarization graph looks when the phase difference between A and B is 270 degrees which is the same as -90 degrees. The amplitude ratio is the same as in figure 3 so the number 23 is shown to indicate that. There is no numerical readout for the phase between A and B. The phase is indicated by the white line in the upper green bar of the polarization bar. When the line is at the center position the phase angle is zero. At the leftmost position the phase is -90 degrees (=270 degrees) and at the rightmost position the phase is 90 degrees. The L in the center indicates that the circular component is left hand. |
|
|
Fig 4. The polarization graph when receiving elliptic polarization.
The amplitude ratio corresponds to an angle of 23 degrees vs the
horizontal plane and the phase between the two signals is -90 degrees.
Permanent parameters as in figure 1.
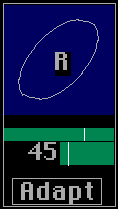
Figure 5 shows the polarization graph when Linrad is adapted to a signal with the same amplitude in both channels and with a phase shift between them of about 45 degrees. Same amplitude means that A and B have the same magnitude so the angle indicator shows 45 degrees. The white line in the upper green bar is about halfway to the right indicating a phase halfway between 0 and 90 degrees. |
|
|
Fig 5. The polarization graph when receiving elliptic polarization.
The amplitude ratio corresponds to an angle of 45 degrees vs the
horizontal plane and the phase between the two signals is about 45 degrees.
The R in the center shows that the circular component is right hand.
Permanent parameters as in figure 1.
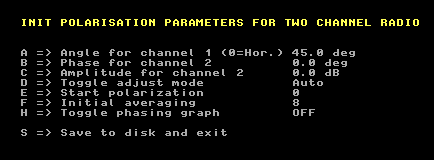
By clicking the Adapt box the user can change it to Fixed and thereby disable adaptive combination of signals. The polarization parameters that are computed from the correlation between the two signals OUT1 and OUT2 in adaptive mode can then be set manually with the mouse on the angle indicator and on the phase ruler. By computing the correlation between the out signals one gets corrections to the currently used parameters rather than a set of fresh parameters. This will be practical when more complicated strategies for adaptive polarization are introduced. The current adapt function minimizes the power weighted correlation within the selected bandwidth provided that S/N seems reasonable. It does not work (of course) well when two stations with different polarization parameters are present within the passband. The lower green bar has a white line which sets the time constant for the adaptive mode. Move leftwards for faster action. Figure 6 shows the permanent parameters set up for a cross yagi in the X configuration. |
|
|
Fig 6. This setup is for a cross yagi in the
X configuration. The different setup in figure 6 does not make the polarization graph look any different. The parameters A and B required to produce a graph like figure 2 would not be 1 and 0 but A=B=cos(45 degrees). Pretty obvious, in the X configuration a horizontal or a vertical signal would give the same signal level in both antennas. In case horizontal signals are shown as vertical, change the phase for channel 2 by 180 degrees. That is the change needed for an antenna in the + configuration if the sign is wrong at 45 degrees. (The sign is wrong if the prediction of optimum polarization in the Linrad EME window is wrong when a linear polarization at 45 degrees is received.) The difference between figure 1 and figure 6 is an electronic rotation of the polarization plane by the specified angle. To set the phase for channel 2, tune to a signal that is similar in amplitude in both channels. If you do not see a straight line, estimate the phase shift from the phase indicator and add that phase shift to the phase for channel 2. To set the amplitude for channel 2 is easy for a system in the X configuration. Just listen to a terrestrial signal which is H or V and adjust the amplitude parameter to get the correct indication. It is essential that both antennas point towards each-other, otherwise reflections can distort polarization. Both stations need a reasonably good horizon. It is generally more safe to use a DX station because tropo scatter preserves polarization well. It is difficult to set the amplitude for channel 2 in the '+' configuration. One would need a signal that is equally strong in both channels but that is not possible to obtain by asking a terrestrial station to send 45 degree polarization. Ground reflections come into play and the polarization plane would shift. Best would be to receive a circularly polarized signal from the moon. An alternative is to make the noise floors equal. That would work fine if antennas have the same performance but it is not uncommon for V antennas to have a distorted pattern and thus somewhat lower gain. Luckily the exact amplitude ratio and thus the indicated polarization angle is not needed for full performance. Linrad will combine the two signals in the optimum fashion any way. To SM 5 BSZ Main Page |