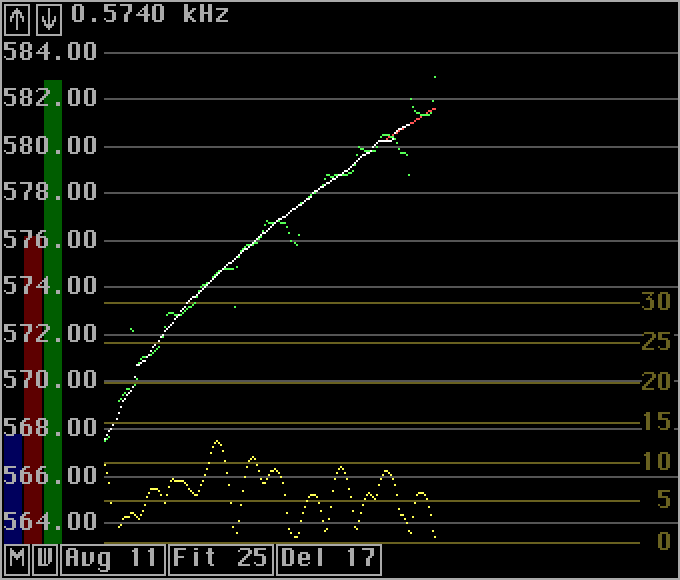
Fig. 1. The AFC graph with UNKN422 as the input signal. The white dots represent the frequency to which the final narrow filter is tuned.
Automatic frequency control (AFC)AFC is typically used in FM receivers to compensate for the thermal drift of the receiver local oscillator. In an analog receiver it is accomplished by use of a capacitance diode in the local oscillator that is DC coupled through a low pass filter to the output of the FM detector. When the receiver is incorrectly tuned, the DC voltage at the FM detector output deviates from the ideal value of zero volts. The feedback to the LO frequency via the capacitance diode reduces the error to a level where distortion is not generated. The big advantage of an AFC circuit is that it allows the use of a narrower bandwidth than would otherwise be possible. A 88 to 108 MHz receiver can use 300kHz bandwidth even with a local oscillator that may drift by +/- 150 kHz. Without AFC one would need more than twice the bandwidth with a significant loss of sensitivity as a consequence.Linrad uses AFC in weak signal CW mode in a similar way. It allows the use of narrower filters than otherwise possible. In CW mode the bandwidth of the signal may be 17Hz and Linrad allows the use of a filter that is only 17 Hz wide. Without AFC, the filter would have to accomodate the combined frequency drift of both transmitter and receiver. Sometimes there may be a varying doppler shift as well. Without AFC the filter will let through something like 2 dB more noise power with a loss of readability as a consequence. Linrad will also have AFC in SSB mode (some day). The purpose is then different. To get good readability of a SSB signal the receiver has to be tuned to within 50Hz or less which will take some time. The Linrad AFC will save time by automatically tuning the system correctly for the SSB signal on which the mouse is placed. The Linrad AFC in SSB mode will automatically detect if the transmission is made in upper sideband mode or in lower sideband mode and place the BFO accordingly.
AFC in weak signal CW modeSince the purpose of the AFC is to allow reception of signals that are too weak to be received without any AFC, the AFC has to be capable of finding the frequency of extremely weak signals.The AFC uses the same spectra as used for the waterfall graph; fft2 if enabled, otherwise fft1. The optimum bandwidth for the fft is the natural bandwidth of the CW carrier which is typically 0.25Hz for 144MHz EME if both stations have frequency stable equipment. When 0.25Hz bandwidth is used for the fft, the total frequency drift should stay below 0.25 Hz in 8 seconds or 1.9 Hz/min. Few stations are stable enough, a practical bandwidth for the waterfall is 1 to 5 Hz. Linrad assumes the frequency drift is largely linear with time. When a new signal is selected, the AFC routine forms averages over a large number of transforms to improve the S/N of any signal that may be present. This averaging will typically be over a period of 10 seconds or more which would smear out signals that drift by more than the fft bandwidth over the averaging time. To avoid this problem, Linrad forms several averages with gradually frequency shifted transforms and this way any signal that drifts linearly with time will have the optimum S/N improvement in one of the averaged spectra. The strongest signal found in any of the averages will give the frequency of the signal as a linear function of time. Once the signal is found, Linrad assumes the frequency drift is not changed so it will try to find the best position for a maximum close to the expected frequency only. Fig. 1 shows the Linrad AFC window. The input signal is the UNKN422.WAV file by AF9Y. The green dots are the average frequencies calculated from a spectrum that is averaged over 11 points symmetrically placed in time around the point in time where the point is placed. The yellow dots are the S/N values calculated from the same average spectrum. The red points is a straight line in 25 points that is fitted to the 25 most recent green points. The fitting is done with the frequency values weighted by the S/N ratio, points in time where the signal is missing does not contribute to the line fitting which is done by the linear least squares fit method. The white dots are the 17th point of each fitted straight line. The white points are the frequency values to which the final narrow filter is tuned. The operator may select another number than 11 for the number of transforms to average over. Just place the mouse on the "Avg" box, click and enter a new value. Likewise the length of the straight line and the delay can be changed on the fly. When zero delay is selected, the frequency will be extrapolated from old data and that is of course bad for accuracy - but in some situations avoiding a delay may be more important.
|

Fig. 1. The AFC graph with UNKN422 as the input signal. The white dots represent the frequency to which the final narrow filter is tuned. |
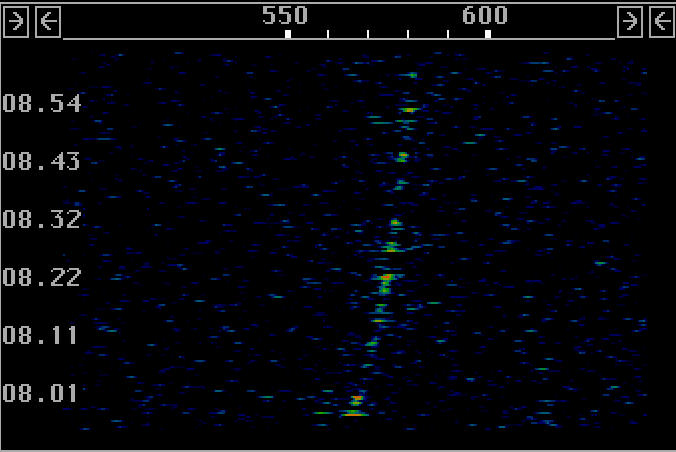
The "W" box to the left of the "Avg" box can be used to select or deselect a window function for the formation of the average spectrum. The AFC averaging window produces smoother average frequency curves but the averaging has to be taken over more points for the same S/N improvement. Fig. 2 shows the waterfall graph produced by the very same transforms as were used to produce fig. 1. There is no averaging in fig. 2, each green dot in fig. 1 is based on the average of 11 transforms but since the window is enabled only the center transform is included with full amplitude, the other transforms are attenuated by a cosine function.
|

Fig. 2. Waterfall diagram produced by the very same transforms as those used for figure 1. This waterfall was present on the Linrad screen simultaneously with the afc graph of fig.1. |
Besides the averaging parameters, the bottom row has a box for AFC mode control. The only mode currently available is "M" for manual and "-" for AFC off. Some day there may be an automatic mode.... The three bars at the left side of the AFC graph can be used to control the AFC process. The blue bar sets the minimum S/N required to lock on a signal. If there is no signal present, it is better to stay at a fixed frequency than to track the random maximum frequency of the noise floor. The green bar can be used to limit the search range. The AFC will lock to the strongest signal within the search range and if the operator wants to listen to a weak signal very close to a strong one, this control can be used to make sure that the AFC will search a small enough frequency range for the desired signal to be the strongest one. The red bar can be used to limit the the range over which the search for a maximum is done while the AFC is locked. A signal that drifts continuously with time will be very close to where Linrad expects to find it. It is better to flag the frequency as invalid than to search a wider range and possibly get data points based on noise only into the line fitting procedure. Pushing the red bar up to maximum may be helpful for very unstable signals that make occasional frequency jumps. In such cases it is best to set the "Fit" parameter to 1 and to use the smallest "Avg" value compatible with the signal level.
AFC in normal CW modeNormal CW mode is similar to a conventional receiver with a CW filter. The bandwidth is assumed to be set wide enough to accomodate any frequency drift. A small processing delay is essential but AFC would be of little use.
AFC in meteor scatter CW modeThis mode is identical to the weak signal CW mode. The CW speed is quite different so the bandwidths an timings have to be set accordingly. The frequency drift may be very large, several hundred Hz per second but the propagation path does not broaden the signal so chances are good that the AFC will allow use of coherent averaging, something that would greatly improve the sensitivity for high speed meteor scatter.
AFC in SSB modeIn SSB mode the AFC will be entirely different from the AFC in CW modes. The frequency of the carrier has to be located by an analysis of a large number of low resolution transforms. The human voice is rich in overtones, the corresponding SSB signal therefore has several equidistant peaks that can be extrapolated back to the carrier frequency. On the basis of a single spectrum it is not possible to decide where the carrier is, there will be several possible positions. By looking at several spectra it is possible to find the only position which is consistent with all of them. The frequency of the human voice varies during normal speech. Therefore the separation between the equidistant peaks vary. |