
Complex signals, I and Q pairs.A complex voltage is two simultaneous voltages obtained from a quadrature mixer, also called an I,Q pair. A complex voltage sampled at a sampling frequency F can represent voltages with frequencies between -F/2 and +F/2. The Nyquist theorem tells us that a (single) signal sampled at the frequency F contains frequencies from zero (DC) to F/2. With two channels I and Q for the same signal, twice as many data points and twice as much information, we should expect the bandwidth to be twice as large compared to the Nyquist frequency for each of the signals individually.The quadrature mixer which is actually a pair of mixers operated with phases between RF and LO that differ by 90 degrees is difficult to realize in analog circuits. The amplitudes may differ slightly and the phase might not be shifted exactly by 90 degrees. Small amplitude or phase errors in the mixers, amplifiers and filters as well as the A/D converters themselves cause poor separation between positive and negative frequencies. If there is an amplitude error of 1%, with amplitudes of I=A and Q=1.01A, the complex signal will not only represent the true signal at frequency Fs with an amplitude of 2.01A. It will also represent a signal at the frequency -Fs, the mirror frequency, with an amplitude of 0.01A. The power ratio would be 46 dB and that is not a good enough suppression of unwanted signals in a receiver. Yet we can not hope for better even when using very good components. It is possible to minimize the mirror frequencies by use of trimmers in the hardware to balance the amplitudes and to set the phase excactly. Unfortunately, in real life, this will only work perfectly for a single frequency. If there are no filters and timing for the two 90 degree LO signals as well as for the A/D sampling clock are controlled by fast digital circuits, it is possible to make the attenuation of the mirror frequency very good over a wide bandwidth by hand tuning the hardware. One can also do the same thing in software. It is obvious that tuning the amplitude is just to multiply one signal with a suitable value that makes the I and Q amplitudes equal. Phase tuning is obtained by adding or subtracting a small fraction of I from Q. Whether in software or hardware, manipulating amplitudes or phases of the signals themselves is error correction in the time domain. Correction in the frequency domainIn case analog filters are used to protect the A/D converters from strong signals outside the desired passband, the phase and amplitude errors will change with frequency. In a unit like the WSE2500 where very high Q filters are used this phenomenon makes it impossible to get a reasonable performance by balancing I and Q in the time domain. Linrad therefore uses a procedure to do the mirror image cancellation in the frequency domain.When a false signal occurs at the mirror frequency due to poor mixer balance, the false signal has a fixed phase and amplitude relation to the true signal. Linrad has a calibration procedure that establishes these relations at a selectable number of frequencies. They are then used to linear combine positive and negative frequencies for the false signals to disappear. The success of the procedure depends primarily on the stability of the quadrature mixer and associated filters and amplifiers. S/N of the calibration signal may also affect the result. It should be noted that digital quadrature mixers such as the one in a SDR-14 or a SDR-IQ do not have amplitude or phase errors so they need no calibration. Check this link digital balancing of amplitude and phase for complementary information to the information below. Calibrating WSE convertersFigure 1 shows an uncalibrated WSE unit when receiving a signal about 10 kHz from the center frequency. The mirror image is suppressed by 40 dB. Figure 2 shows what happens when the signal is moved near the passband edge, about 42 kHz from the center frequency. Here the image frequency is only suppressed by 24 dB, an effect of tolerances on the high Q analog filters |

|
|
Fig. 1. A uncalibrated WSE system with a test signal
about 10 kHz from the center frequency.
At 10 kHz the anti-alias filters do not contribute much
to the phase and amplitude balance.
The error is mainly in the amplitude and it is determined by
resistor tolerances.
|

|
|
Fig. 2. An uncalibrated WSE system with a test signal
about 42 kHz from the center frequency.
At 42 kHz the anti-alias filters cause large errors in the
phase and amplitude balance.
Everything except the frequency setting of the signal generator
is the same as in figure 1.
To enter the calibration routine, press X on the normal receive menu, then C for calibrate. That should produce the menu shown in figure 3. Press A to get to the data input screen which is shown in figures 4 and 5. |

Fig. 3. The Linrad calibration menu for a system with complex input (I and Q) from a soundcard. With an SDR-14 or SDR-14 the A option is missing. |
|
Connect a signal generator to the antenna input, feed the same signal into both inputs in case you have enabled two RF channels. Turn the level of the signal generator for about 50% level on the A/D converters. When everything is adjusted to your satisfaction, clear data that might have been collected while you were changing signal levels etc. by pressing 'C'. In case the system is already calibrated and you only want to refine to absorb effects of ageing or temperature differences, press plus and then minus to clear collected data while keeping the old calibration. |
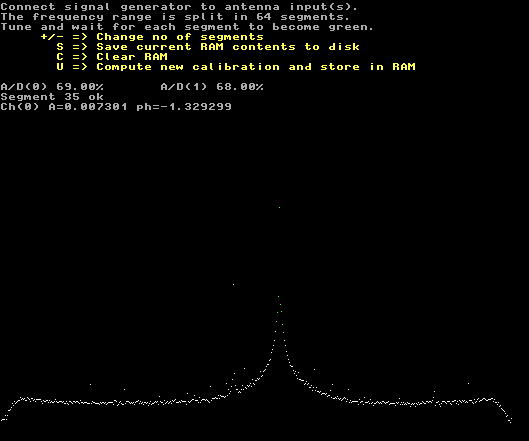
Fig. 4. The data input screen for the I/Q balance calibration. The magnitude of the error is 0.36% at this point near the center frequency. (The magnitude of the difference between I and Q is 0.73% of the magnitude of the sum.) |
|
|
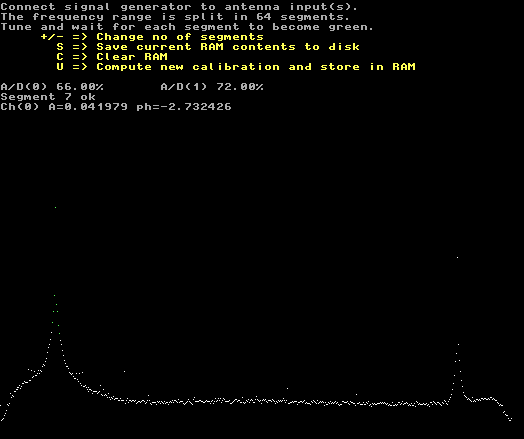
Fig. 5. Same as figure 4, but at a much higher audio frequency. Here the magnitude of the error is 2.1% |
|
It is convenient to do calibration with a synthetized signal generator that can be set for a step length equal to the segment separation. With 64 segments and 96 kHz sampling, the step size is 1.5 kHz. The procedure is simple. Step to another frequency. The points should turn from white to red. Then after a while they should turn green. Once the points on the current frequency are green, step to another white region. When all points are green, press 'U' to compute the correction function. You should see a screen like the one in figure 6. When you press enter, the correction will be applied and you will return to the data input screen which might look like figure 7. |
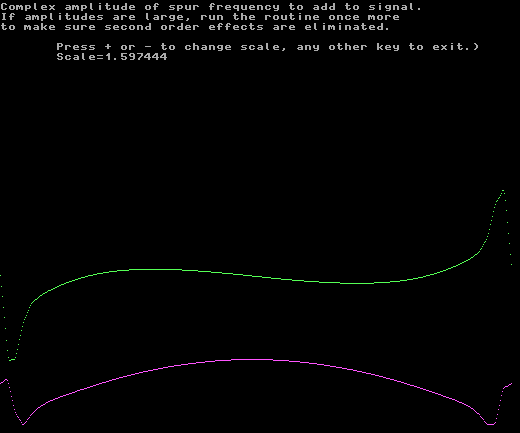
Fig. 6. The correction needed to eliminate the mirror image of the uncalibrated system. |
|
|
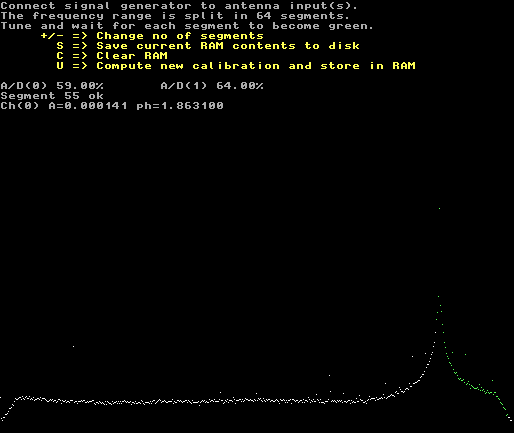
Fig. 7. The data input screen in the second iteration when the correction function of figure 6 is applied. Note that the error now is only 0.007% despite the fact that the signal is far from the passband center. |
|
After a couple of iterations, the results no longer improve. The correction might look like in figure 8. The image suppression is typically 80 dB as shown in figure 9. |
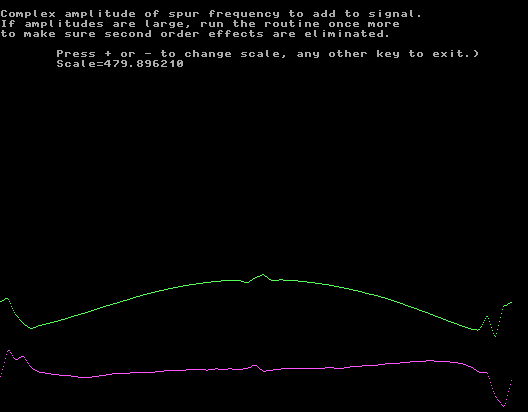
Fig. 8. The correction does not get smaller than this on a WSE system. This screen is after four iterations. Note that the scale is magnified about 300 times (50 dB) compared to the scale in figure 6. |
|
|
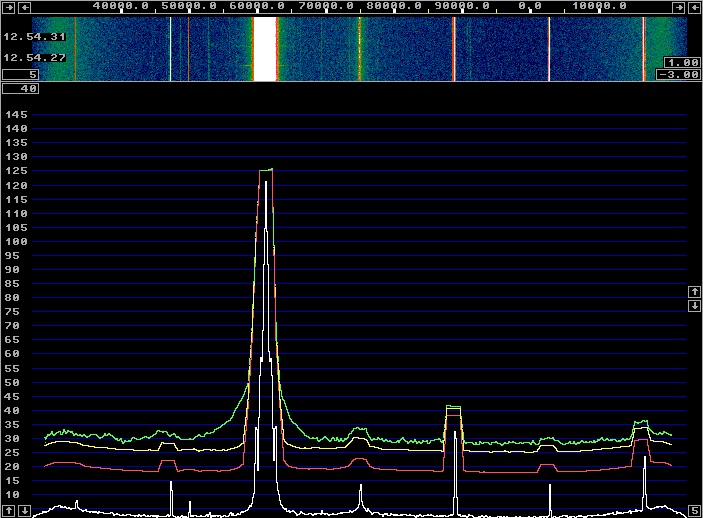
Fig. 9. The calibrated WSE system. |
|
All the calibration was done with a HP8657A signal generator with Linrad in txtest mode (to make easier to see graphs) and with a FFT1 size of 16384. Figure 9 was made with a HP606B which is an old analog generator with about 10 dB less sideband noise. (Compare figure 9 with figure 1.) By tuning the HP606B slowly over half the screen in txtest mode, one can get the image suppression over half the passband as shown in figure 10. For this figure, calibration was made with an FFT1 size of 65536 and the image suppression is about 90 dB over 50% of the total bandwidth. Narrower FFT bandwidth gives a better S/N for the calibration signal. Such an effort with the calibration is however meaningless with the WSE units. One hour later the image suppression has degraded significantly as can be seen in figure 11. The limitation is the stability of the analog hardware. |
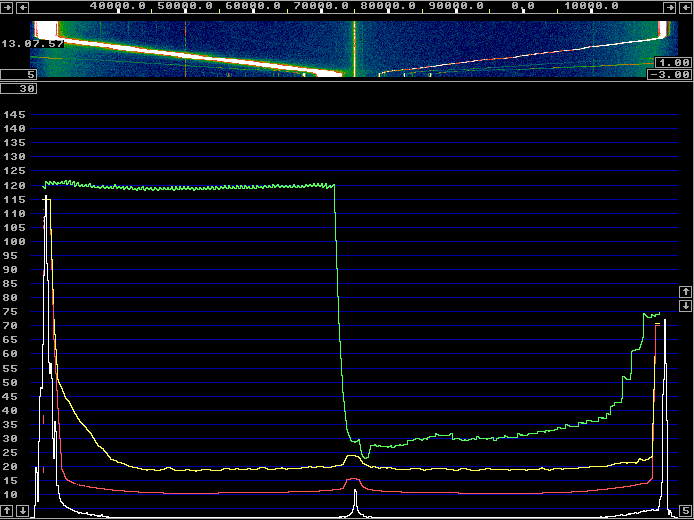
Fig. 10. A signal swept across half the screen of an accurately calibrated WSE unit immediately after calibration with 65536 transforms for FFT1. |
|
|

Fig. 11. The same as figure 10, but one hour later. |
|
By leaving the signal generator on a fixed frequency and only allowing one segment to turn green, one can rapidly cancel the image on that particular frequency. Figure 12 shows the S-meter for 20 minutes after such a calibration in weak cw mode with two RF channels. Immediately after calibration the image suppression is better than 100 dB, but only for about one minute. |

Fig. 12. Mirror image suppression during 20 minutes immediately after accurate calibration. |
|
It is obvious from figure 12 that the two channels are quite different. The blue track, channel 1 (H), seems to suffer from a poor contact somewhere while the red track looks more like thermal drift. The AM(?) noise modulation in channel 1 contributes to the close-in sideband noise of this channel, but it is not visible in the normal sideband noise measurements since the phase noise from the oscillators dominates. When calibrating a few times per year, Linrad with WSE converters should provide a mirror image suppression of at least 70 dB with warmed up units. |