|
The data file used for all images on this pags
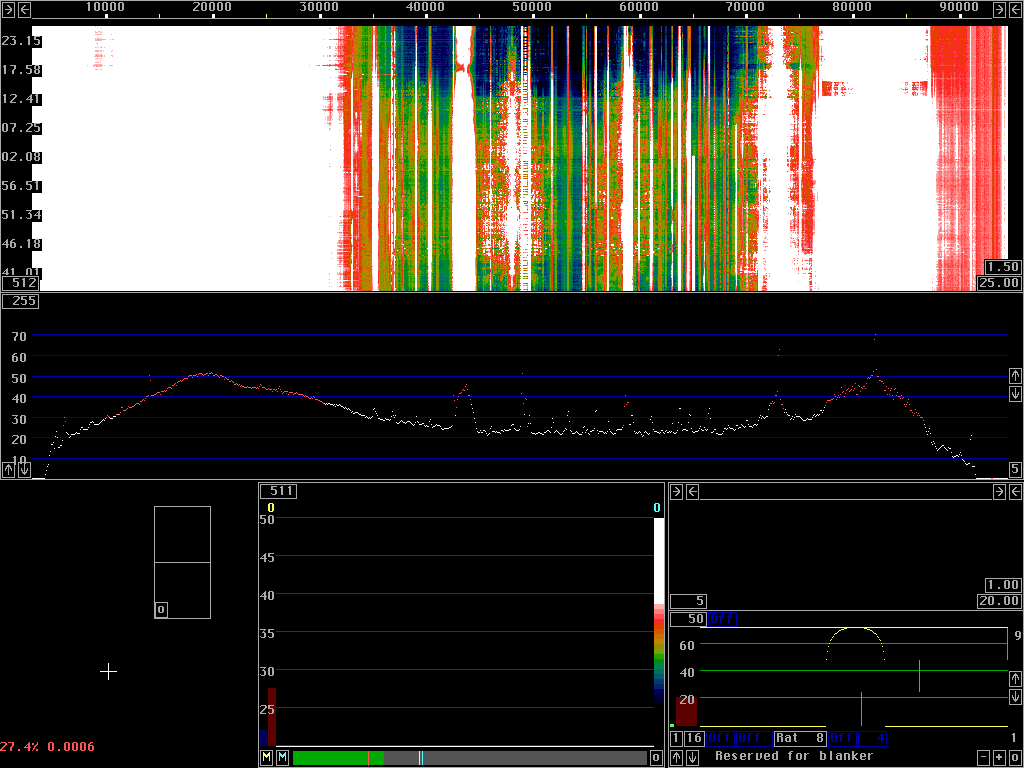
Figure 1 shows the main spectrum and the waterfall graph at modest resolution. The FFT size is 4096 for both fft1 and fft2, but the screen is only 1024 pixels wide so both the normal spectrum and the waterfall diagram are drawn with 4 data points for each pixel. The figures 1 to 7 are produced with the Linrad noise blanker and pulse removal functions enabled (dumb and smart blanker). These figures differ in that the waterfall resolution is a factor of four higher for each sucessive image. The noise blanker setting is the same for these images. To achieve this, the fft1 and fft2 averaging numbers have to be reduced when the fft sizes are increased so the selective limiter operates can operate on averages that span the same total time.
|
|
Fig 1.
Signals at 137kHz June 17 2003.
X-axis is 93.75 Hz/pixel but each pixel is based on 4 FFT
bins because both fft1 and fft2 have the size 4096.
This spectrum shows the entire 90 kHz frequency range.
The frequency scale offset is 80 kHz.
The 137773 kHz amateur signals are at 57773 on the figure.
The images on this page are screen dumps from what will become Linrad-01.04. To accomodate for more functions on screen, the parameter input functions have been moved into the window they belong to, the settings of fig. 1 are:
waterfall averaging = 512
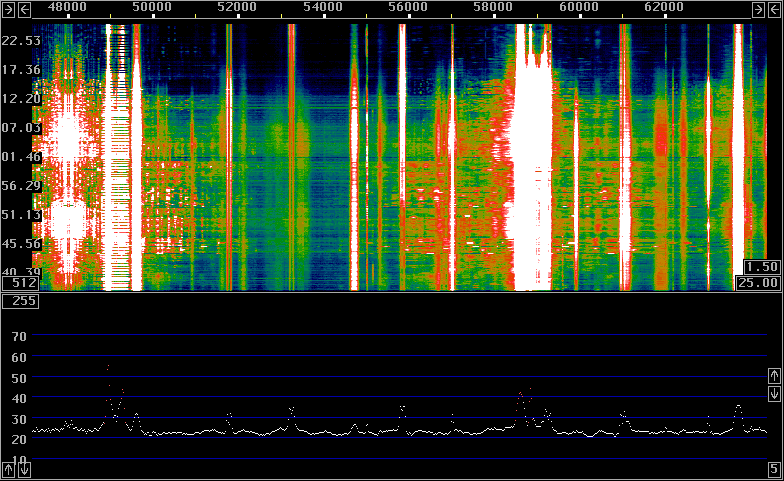
Note that the selective limiter controls, the red and blue bars at the left side of the high resolution graph are very low. This is permissible because the fft1 and fft2 averaging numbers are very large. The blanker thresholds are about 10 dB above the noise floor. The green bar in the blanker control field is the noise level in a dB scale in which the red line marks a level of 20dB above 1 bit, the point where the bar starts. The green bar ends at about 24 dB while the blanker controls, the blue and yellow lines are at about 34dB. Figure 2 uses exactly the same processing parameters as figure 1. The only difference is that the display has been expanded four times for the spectra to be shown at one pixel per fft bin.
|
|
Fig 2.
Signals at 137kHz June 17 2003.
Same processing as fig. 1 but the scale is expanded four times
for one pixel per fft bin.
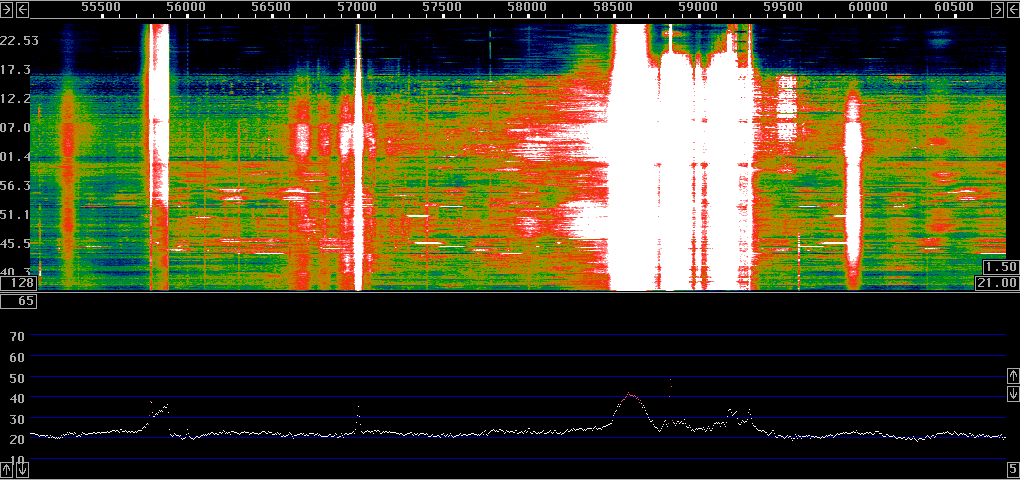
When looking carefully at fig 2 one can see some CW code, two dashes and a dot towards the end of the recording where the noise level is a little lower. The CW signal is at about 58000 on the frequency scale. In figure 3 the fft1 and fft2 sizes are both 16384 for a bin width of about 12 Hz. The frequency scale is 5.86 Hz/pixel.
|
|
Fig 3.
Signals at 137kHz June 17 2003.
The fft size is 16384 for both fft1 and fft2.
A qrss signal is clearly visible at about 57770 Hz at the top
of the waterfall where the noise floor is lower.
Figures 4 to 7 all have the same size for fft1, 16384 but the size of fft2 is increased a factor of four between the images.
|

|
Fig 4.
Signals at 137kHz June 17 2003.
The fft2 size is 65536 for 1.46 Hz per fft bin.
The qrss signal at about 57770 Hz is visible all the time
but it is not possible to copy any information at a bin bandwidth
of as much as 3Hz.
|

|
Fig 5.
Signals at 137kHz June 17 2003.
The fft2 size is 262144 for 0.37 Hz per fft bin.
The qrss signal at about 57772 Hz is better visible at a bin
bandwidth of 0.75 Hz but copy is still not possible.
There is more than one signal present!
|
|
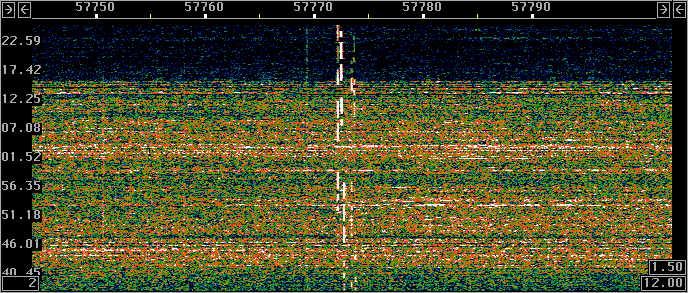
Fig 6.
Signals at 137kHz June 17 2003.
The fft2 size is 1048576 for 0.091 Hz per fft bin.
One can see at least four different stations.
Half an hour is not enough to decode unknown qrss signals
but at least two stations are good copy at a bin bandwidth of
0.18Hz
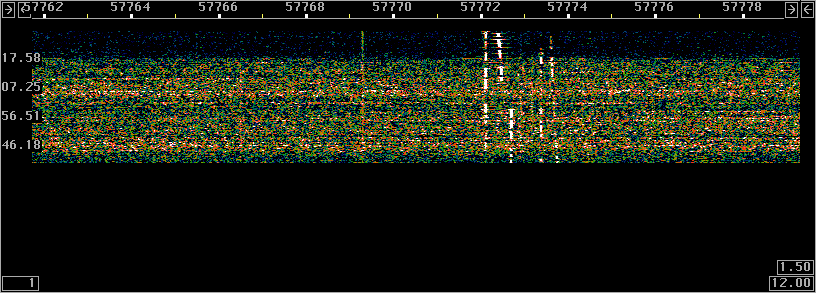
Figure 7 with over four million bins in the fft shows the narrowest bin width allowed by Linrad. This transform size is already far too large to be useful, to display the whole spectrum at one pixel ber bin one would need 4096 screens side by side..... The above series of images show the significance of using a narrow bandwidth for qrss. The noise blanker is far less important, figure 8 shows the same processing as figure 7 but without the Linrad blankers.
|
|
Fig 7.
Signals at 137kHz June 17 2003.
The fft2 size is 4194304 for 0.023 Hz per fft bin.
There are five stations visible at a bin bandwidth
of 0.047 Hz.
The signal at 57769.3 is a calibration signal
at 137770.00 Hz exactly injected from a HP8657A
signal generator.
|

|
Fig 8.
Signals at 137kHz June 17 2003.
The fft2 size is 4194304 for 0.023 Hz per fft bin exactly as fig.7.
This waterfall is obtained without the Linrad noise blankers.
The waterfall colour-scale is shifted by 4 dB.
By comparing figures 7 and 8 one can see that the noise blanker gives an improvement of about 3 dB during the first 70% of the recording where splatter from modulated transmitters dominates while it gives about 5 dB improvement during the remaining time.
|