SM 5 BSZ - Blanker demo, linrad00-29
(Nov 01 2001)

The linrad noise blanker on real signals in a contest

Figure 1 shows the terrible interference caused by powerlines in dry weather. This interference consists of pulse trains with 3 to 6 pulses separated by about 0.5 milliseconds. The pulse trains occur at a frequency of 100Hz. These pulses are produced by a defective insulator that acts as a spark gap in series with a capacitor. In humid weather the spark gap becomes a resistor and then there is no powerline noise from this isolator.


Fig 1. No blanker. Note that the powerline noise has short quiet periods. The difference between blue and white is about 20dB. The colour scale in the high resolution graph can be used to read dB from the waterfall graph. (This scale is not in agreement with the waterfall colours in linrad versions older than 00-29)

Figure 2 shows the screen for the same sequence of data when the dumb noise blanker is enabled and fig.3 when both blankers are enabled (normal operation mode). The difference between fig 2 and fig 3 is very small. The interference situation is not really so bad, the dumb blanker does a fairly good job. There are two strong ssb signals. The one at 25kHz is good and the smart blanker makes a visible improvement. It allows the dumb blanker to clear fewer points so smaller noise sidebands are created around the strong signal. The other ssb signal at 50kHz has too much splatter so the extra noise generated by the dumb blanker is invisible.


Fig 2. Same data as fig.1, dumb blanker only enabled.


Fig 3. Same data as fig.1. Normal operating mode, both smart and dumb blankers running.

The selective limiter

Fig 4 shows what happens when the selective limiter is disabled. Here both signal thresholds, the blue (for fft1) and the red (for fft2) bars at the left side of the high resolution graph are in their top positions. As a consequence, no signal is above the threshold and therefore all signals are treated as weak signals. The effect is that the dumb blanker operates as a conventional noise blanker. Each time a pulse is removed, all strong signals are gated out for the duration of the pulse which causes "keying clicks" that are proportional to the instantaneous amplitude of the strong signals.


Fig 4. Same data as fig. 1. The selective limiter is disabled. Note that there are no red points in the main spectrum. Here the dumb blanker operates just like any other blanker and creates noise when strong signals are present in the passband.
The selective limiter uses the main spectrum to find where the strong signals are. The input to the selective limiter routine is the curve that is displayed on the screen. If the averaging is small, high thresholds have to be used but with more averaging the noise floor becomes smoothed and a lower threshold is possible. The bars in the high resolution graph is the S/N a signal must have to be regarded as a strong signal. The blue bar for fft1, the spectrum with blue dB scale. The red bar for fft2, the waterfall graph and the high resolution graph with red dB scale. Fig 5 shows what happens if the fft1 threshold is set too low, causing part of the noise floor to be treated as strong signals.


Fig 5. Same data as fig. 1. The fft1 threshold is set too low for the averaging used in the fft1 spectrum. The fft2 threshold is set high. Note that a large fraction of the noise floor is represented by red pixels. This means that a large fraction of the noise floor is treated as strong signals.
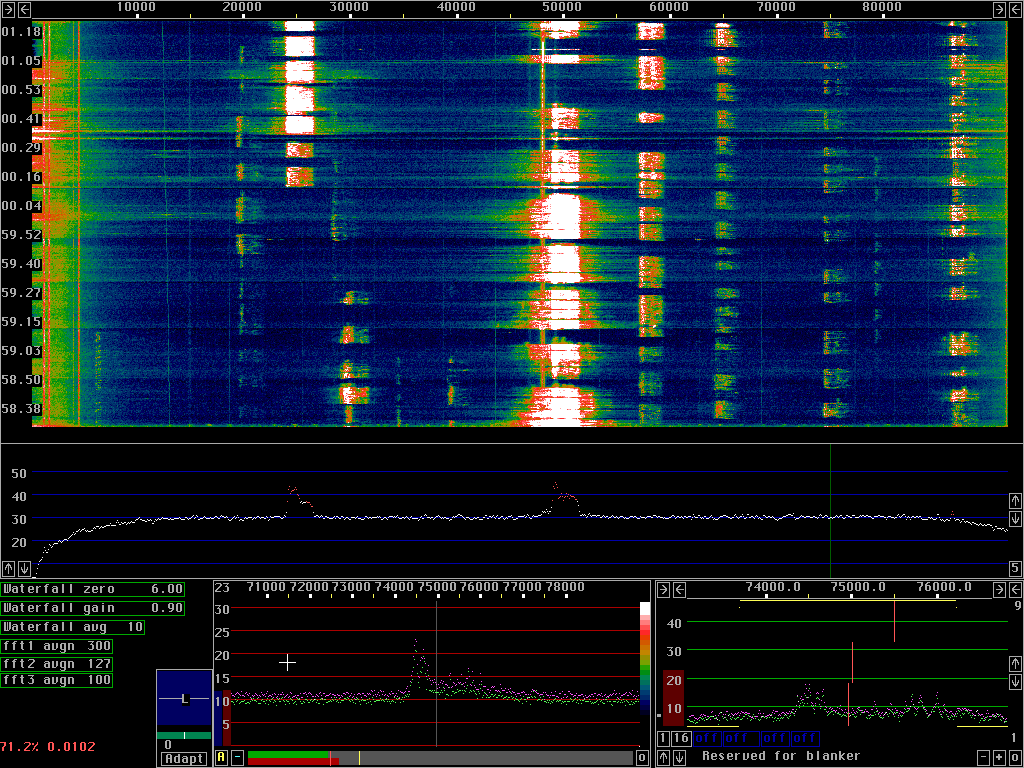
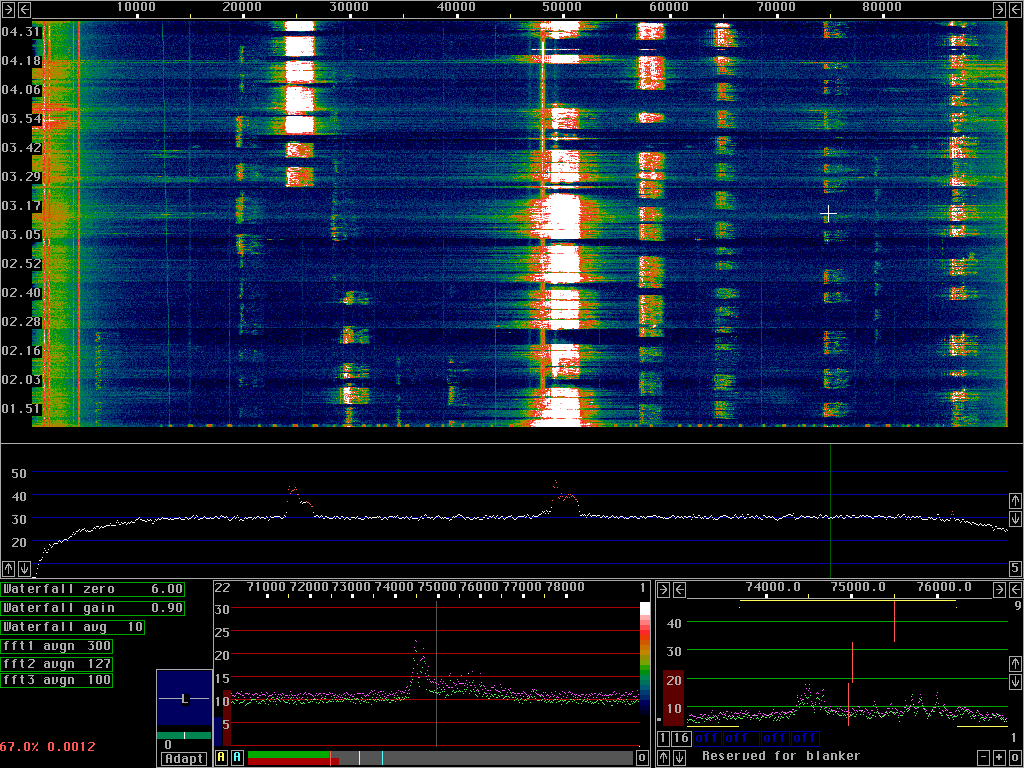
When some part of the noise floor is excluded from the weak signals, the blanker will not operate on the corresponding frequencies which means that the interference pulses are not removed on these frequencies. As a result strong signals of short duration occur on the waterfall graph. 
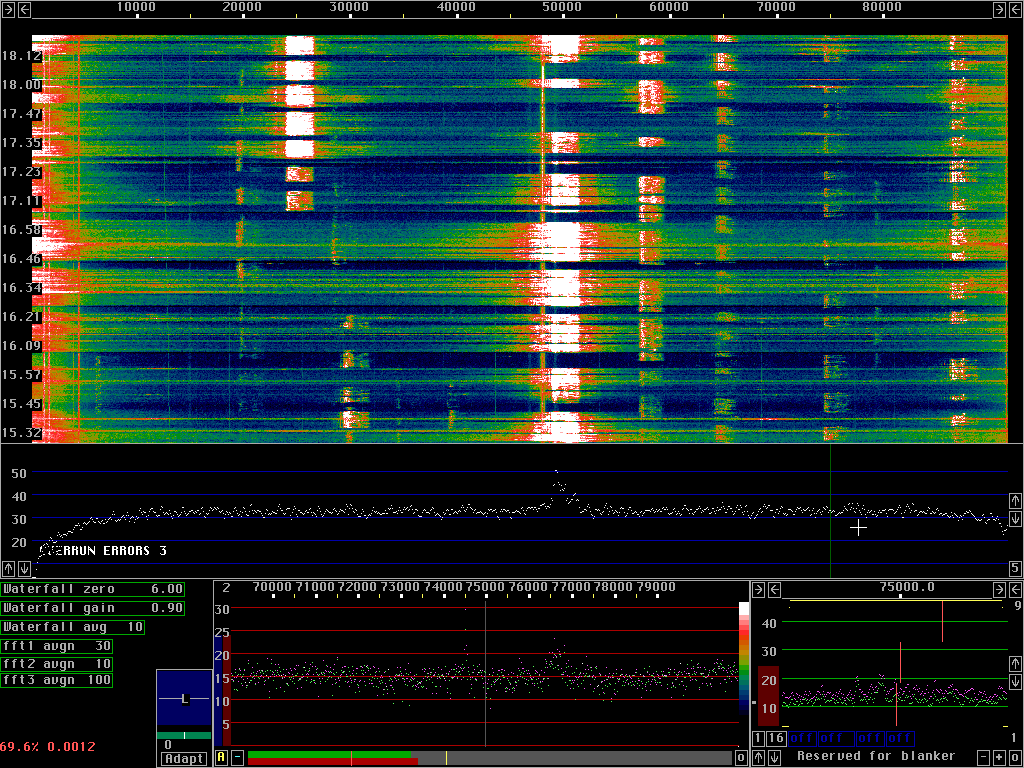
This phenomenon is particularly pronounced when the interference level is unstable causing the fft1 noise floor to jump up and down by tens of dB's. Note that the selected frequency, the passband selected in the baseband graph, is always treated as weak signals. This is new from linrad00-29 and is clearly visible in fig. 5.

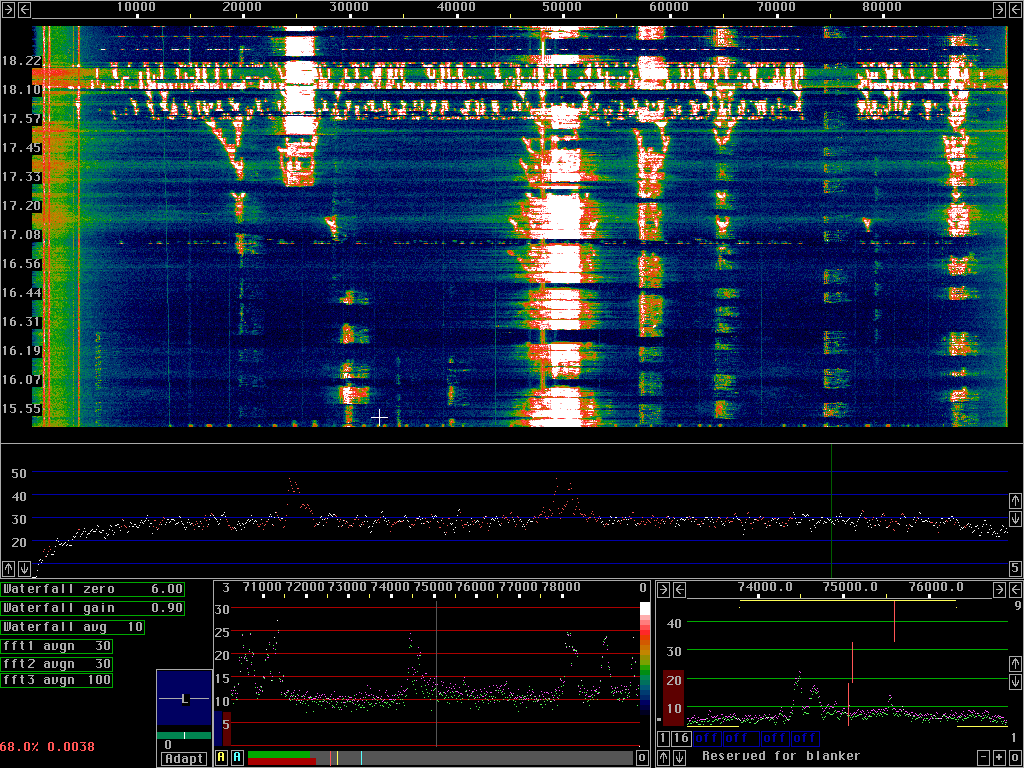
Fig.6 shows what happens if incorrect settings of the fft1 threshold is combined with similar settings of the fft2 threshold. The artificial signals seen by fft2, created by an incorrectly placed group of red dots, will cause a real output from fft2 which will keep the frequency red in case the fft2 threshold is low enough and fft2 averaging is small enough for a signal of short duration to get sufficient amplitude.

Linrad allows currently only the mode intended for weak cw signals. When averaging is set up in a reasonable way for weak cw signals the selective limiter thresholds are easy to set properly. Other modes will have selective limiter control differently arranged. When "misusing" linrad in weak cw mode to listen to ssb signals or to get very fast response one has to be observant on possible malfunction of the selective limiter.


Fig 6. Same data as fig. 1. The fft1 threshold is set too low for the averaging used in the fft1 spectrum. The fft2 level is also set low. Note that a large fraction of the noise floor is represented by red pixels. This means that a large fraction of the noise floor is treated as strong signals.