Testing the AFC of linrad
Path modulation
Narrow bandwidth is used to receive weak signals.
This is because the amount of noise power received
is directly proportional to the bandwidth of the receiver filter while
the amount of received signal is independent of the bandwidth of
the receiver filter as long as the bandwidth of the signal itself
is not greater than the bandwidth of the receiver filter.
To communicate at N times weaker signal level one just has to
reduce bandwidth by a factor of N and allow the
transmission to take N times more time!!
Now there is a limit to how far one can take this strategy.
Even with perfect frequency stability of receiver and transmitter
the frequency of the received signal will vary at random
due to the variation in time it will take for the signal to
travel between transmitter and receiver.
The medium between transmitter and receiver is never perfect
vacuum - and the properties will vary more or less with time.
Even interstellar space is a plasma - and it is moving!!
More significant than the medium itself is multi path propagation.
This is valid for terrestrial signals as well as for signals
reflected off the moon.
The fading (amplitude modulation) and the phase modulation
added to the signal by the transmission path will contain a random
component that causes some finite width to a pure carrier.
Using a bandwidth below the bandwidth of the phase modulation
will cause loss of signal and is no good idea!
To design the optimum communication method that will allow the
lowest possible power for a particular transmission path one has
to know where the limit is for minimum bandwidth.
The systematic path modulation (doppler shift) can be compensated for
but the random component gives a minimum bandwidth.
The EME path
The moon is a very large object and it is obvious that signals
reflected from different parts of the moon will arrive after
different amounts of time.
Since the moon is rocking the relative amplitudes will vary and
therefore the phase of the different waves that will compose the
total signal will vary at random.
Consequently the sum of all the contributions will vary in both
amplitude and phase.
This is the well known libration fading.
Another way to understand it is to say that signals reflected from
one side will be doppler shifted differently from signals reflected
from the other side.
One side is moving towards earth due to the rocking movement while
the other side is moving away from earth.
On 10GHz the EME signal has a bandwidth of about 300Hz, clearly
much greater than the bandwidth normally used for the communication
modulation.
One might think that the path modulation is proportional to the
bandwidth and that therefore the bandwidth would be about 4Hz
on 144MHz.
As it turns out, the bandwidth is much narrower, by more than 10
times.
The reason is that the moon is a rough surface at 10GHz
while at 144MHz the moon is a smooth surface. (in terms of
wavelengths)
144MHz is probably the amateur band that will allow the narrowest
bandwidth and therefore 144MHz is the band where new, extremely
narrow banded digital communication modes can be applied.
50MHz will give less libration fading, but probably the scintillation
fading due to the effects of the earth's atmosphere will
increase the bandwidth beyond that of 144MHz.
Typical signals at 144MHz
Modern amateur equipment has good frequency stability and
the frequency is often not drifting by more than a few Hz per
minute due to thermal effects.
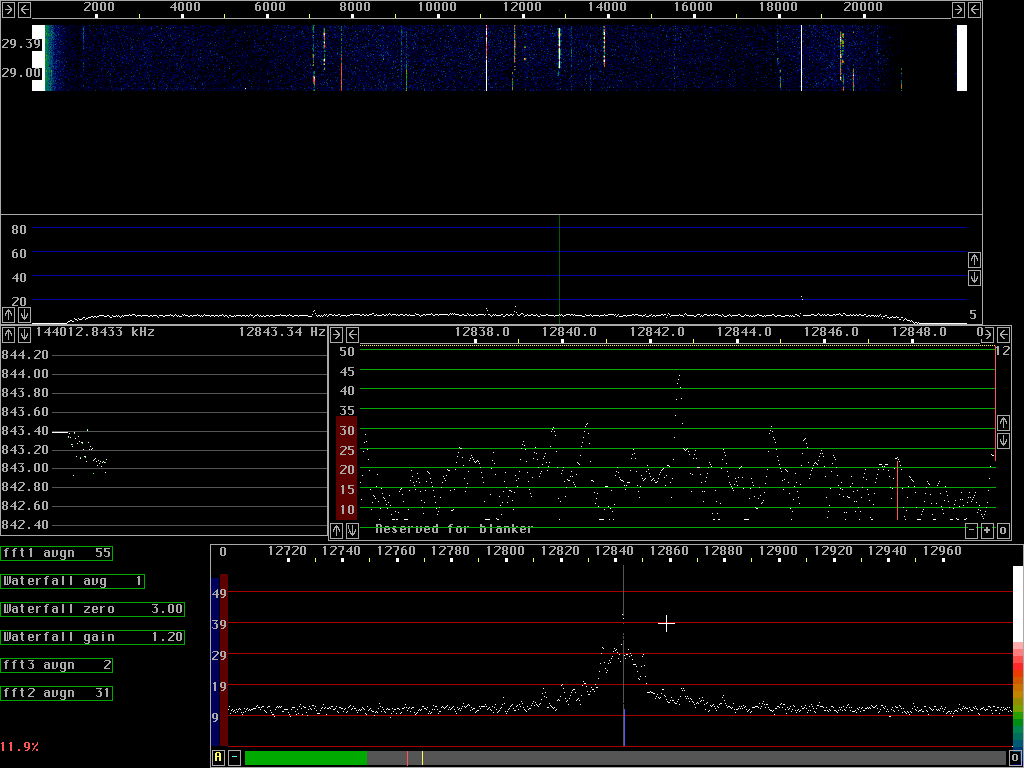
Figure 1 shows a screen dump of linrad after receiving a 1 minute
transmission from IK3MAC (from a DAT tape).
The AFC graph shows how the frequency has drifted by 0.35Hz
during the transmission.
The actually measured frequency for a single fft is scattered
by up to 0.2Hz as shown by the green dots.
The frequency used to downconvert the signal from
12.843.3 kHz to the baseband is derived as the average
of about 10 frequency values, weighted by the corresponding
S/N ratio and is shown by the white pixels in the AFC graph.
The baseband graph shows the signal at 12832Hz.
The baseband frequency scale is currently assuming a fixed frequency
corresponding to the grey center line in the high resolution graph
was used for down conversion.
The baseband graph has an fft size of 8192 corresponding to 43 seconds
so each pixel corresponds to 0.02Hz
The graph shows the sum of all powerspectra since start.
Fig. 2 is the same as with fig. 1 with one exception.
There is no averaging of the frequencies determined
from different transforms.
The white points are on top of the green ones in the AFC graph.
The corresponding parameter change is that "AFC averaging time"
is changed from 10 seconds in fig. 1. to 0 in fig. 2.
The two figures differ in that fig. 1 is produced with a local
oscillator that is modulated to follow the frequency of the
signal but with modulation frequencies limited to 0.1Hz (average over 10
seconds) while fig. 2. is following the signal about 10 times quicker,
corresponding to the bandwidth of the high resolution fft (second fft)
The increase in bandwidth from fig.2 to fig. 1 gives 0.2Hz as an
upper limit for the path modulation of the EME path.
| 
